I used this utility (Download here ) and I found it very useful. When we create a project in it, it shows a ton of useful information which is quite handy for debugging the performance issues in the Farm. Their are two tabs in the UI one is Snapshot and other one is Trends. Snapshot shows more of the Static data while the Trends show the real time data on which debugging can be done.
In Snapshot we have have the information like:
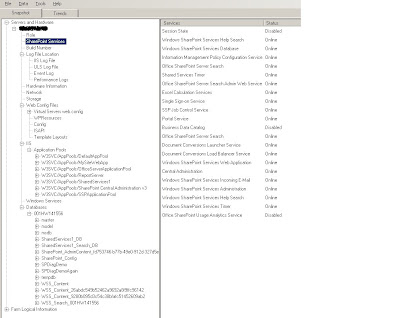
Servers & Hardware:Shows all the servers which we have in the Farm. It shows the information like H/W information, Service running on each server, the build of SharePoint, the databases in the DB and status of each database etc. See the screen shot for the other information that we have:

Farm Logical Information:This is the second set of information which is more related to the what we have created in our Farm. It show all the different Web Applications we have, the content DB's, Solution deployed to the farm, Timer Jobs and their Status and the Content Deployment Path. One of the coolest feature is to display all the large list (having more than 3000 items).

Although all this information can be retrieved from the various sources but it really takes lot of time to consolidate this info. Here we can see all this info in a nice way and which can be updated real time if we are working on a online project.
The other feature is working in offline mode. So this helps me to work on this data on different machine. We can export the data through the Data tab which will create a snapshot in XML which can be viewed through this tool in offline mode.
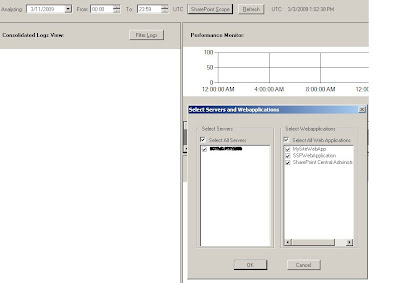
The next thing is the Trends tab. I can decide for how much time we want to analyze the logs here. the next cool thing is select the servers and the web application in which we want to see the trends. I can select all the servers or one and the web applications (I have only one servers in the farm so showing only one).

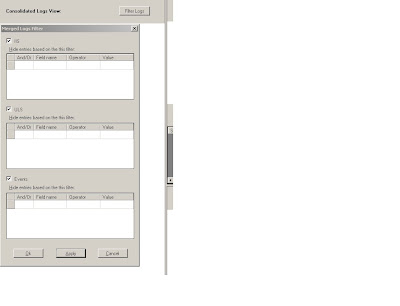
We can select the Logs (IIS, ULS or Events Logs) from which we want to analyze the data. We can use these logs in combination as well. There are option to remove the data based on conditions.

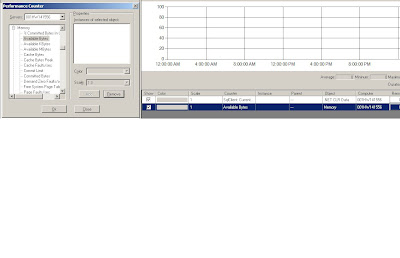
We have the flexibility to select the performance counters available in different servers on which we want to do the monitoring and these counters will be added in the tool.

Based on these performance counters the data will be shown.
I am still experimenting with this and will keep updating this post.
No comments:
Post a Comment